Last year, I posted my blogging stats, compared them over the years, and shared some of my insights. It was nerve-wrecking, but I’m hoping it brought some transparency and maybe even reassuring for some people.
This year, I’m hoping to do the same thing by sharing my stats over the past year — hopefully a little less messy and scrambled, because now we’ve got something to work with! It’s definitely a little less nerve-wrecking this year, though. I feel like making a post made me more comfortable to do one this year, and I’m hoping I can do so each year I’m continuously blogging.
Because talking about blog statistics isn’t entirely normalized just yet, I also want to gently remind everyone before we hop in that the intention of this post isn’t to brag about numbers but rather to normalize them. And also because I’m nosy with my stats, and you must be curious as well if you’re reading this.
Let’s be curious together and wander away into my stats of 2023! (I know tomorrow is March, lol.)
Things That May Have Affected 2023’s Stats
Thankfully, no snafus happened in 2023 like in 2022. There were also no posts being deleted, since I mostly got my ducks together with all the formatting and rebranding from 2021.
While I still post movie/TV show reviews, book-related content still make up most of my content. It’s very possible the WGA and SAG-AFTRA strikes may have affected this, but since I usually focus on Asian dramas, it wouldn’t have made much of a difference. (I’m also just selective about what shows I want to write about; I don’t want to write about every show I watch because I don’t watch that many. Plus, I feel like if I review everything, I’d just suck the fun out of it for myself, and I’d like to not do that.)
Like last year, I’ll be using WordPress Analytics instead of Google Analytics because Jetpack and free WordPress are widely used in the book blogging community. I think the biggest difference in 2023 vs 2022 is the quantity of posts. If you do follow my posts regularly, you’re probably aware that 2023 was not… a good time for my health. Self-care took priority for me in 2023, and I think it shows in my stats as well.
Total Page Views
I never actually shared how many page views I had in 2022, so I thought this year would be a good time to actually include this information! In 2022, I had approximately 14.7k views, with 2023 surpassing it by a large margin and ending with 21.5k views.

Considering I have pretty much been absent most of the year, I was honestly super surprised but at the same time not really. Because most of my posts are reviews, I have that backlog of evergreen posts.
Blog Followers and Average Page Views
2023 had a small jump in followers, with 286 WordPress followers. I didn’t include the number of email followers (for this year and last year’s) because I don’t really have a specific mailing list outside of sending posts when they go live or shortly after (automated), but if you’d like me to include those for future years, let me know!
The average page views per day dropped a little, but it also steadied out compared to 2022 which had a wider range due to a particular post. Even though this year’s post is focusing on 2023 stats, I’m including all the years I’ve been on self-hosted WordPress for full context.

50-60 views per day was my average, with 59 being the actual daily average (I actually just realized the number is right there off to the side). The drop isn’t a surprise since I had about half the posts (and therefore didn’t keep up with the ball rolling like one should do in a corporate setting but this is not a corporate setting and therefore we will not treat this blog as one).
Number of Posts
2022 had a total of 47 posts written, which is approximately a post weekly with a few skips here and there. I’m pretty sure some weeks I did two posts as well, but for the most part of the year, I stuck to a weekly post.
2023 dropped significantly, with 22 posts written. Personally, I thought it was much less — it certainly felt less. It’s about roughly a post every 1-3 weeks, though what’s more accurate is I tended to post in clusters: there would be a string of posts for a few weeks and then I’d go crickets for another few weeks or a couple of months.
So what about consistency?
Last year I made a spreadsheet detailing the total monthly views, average daily views for the month, and the number of posts written in the month to see if consistency played a role in stats. Since I posted much less than usual compared to previous years, I wanted to see if things changed!

There is definitely a little change, but overall, things stayed about relatively the same. Total views and average daily views fluctuate throughout the year, which somewhat follows the number of posts. You’ll notice there are few posts from April-August, and views drop a bit in August-September. It picks up again in November and December, which is in the following months after having more frequent posts.
I think the one thing we need to consider is my review for Fourth Wing by Rebecca Yarros went live in September and Iron Flame published in November, which could’ve possibly contributed to the increase in views. With the hype around the book and the sequel, it makes sense people will be reading/re-reading the first book, searching for reviews/recaps, etc. around the same time.
We see this with the Chinese drama Love Between Fairy and Devil in 2022: my review went up in September, which was when the drama was airing its final episodes, but was also in the process of being added to Netflix US as well. There are a lot of other reviews that I could bring up as examples that follow this pattern, but I think the two is sufficient because otherwise this post would be way longer than needed.
One may think I did this intentionally, but while I sometimes might be intentional with the timing of my posts, these were definitely not intentional (maybe subconsciously) and more like, “I feel like scheduling this post on this day.” We love happy accidents, though.
Top 5-10 Most Viewed Posts
Traditionally, I’ve listed the top five posts in my annual highlights and aspirations/goals post I post in January, but I’m actually going to skip out on it for 2023 (the goals post) because that post is going to be mainly depresso-expresso. But the top posts of the year are definitely relevant to blogging statistics!
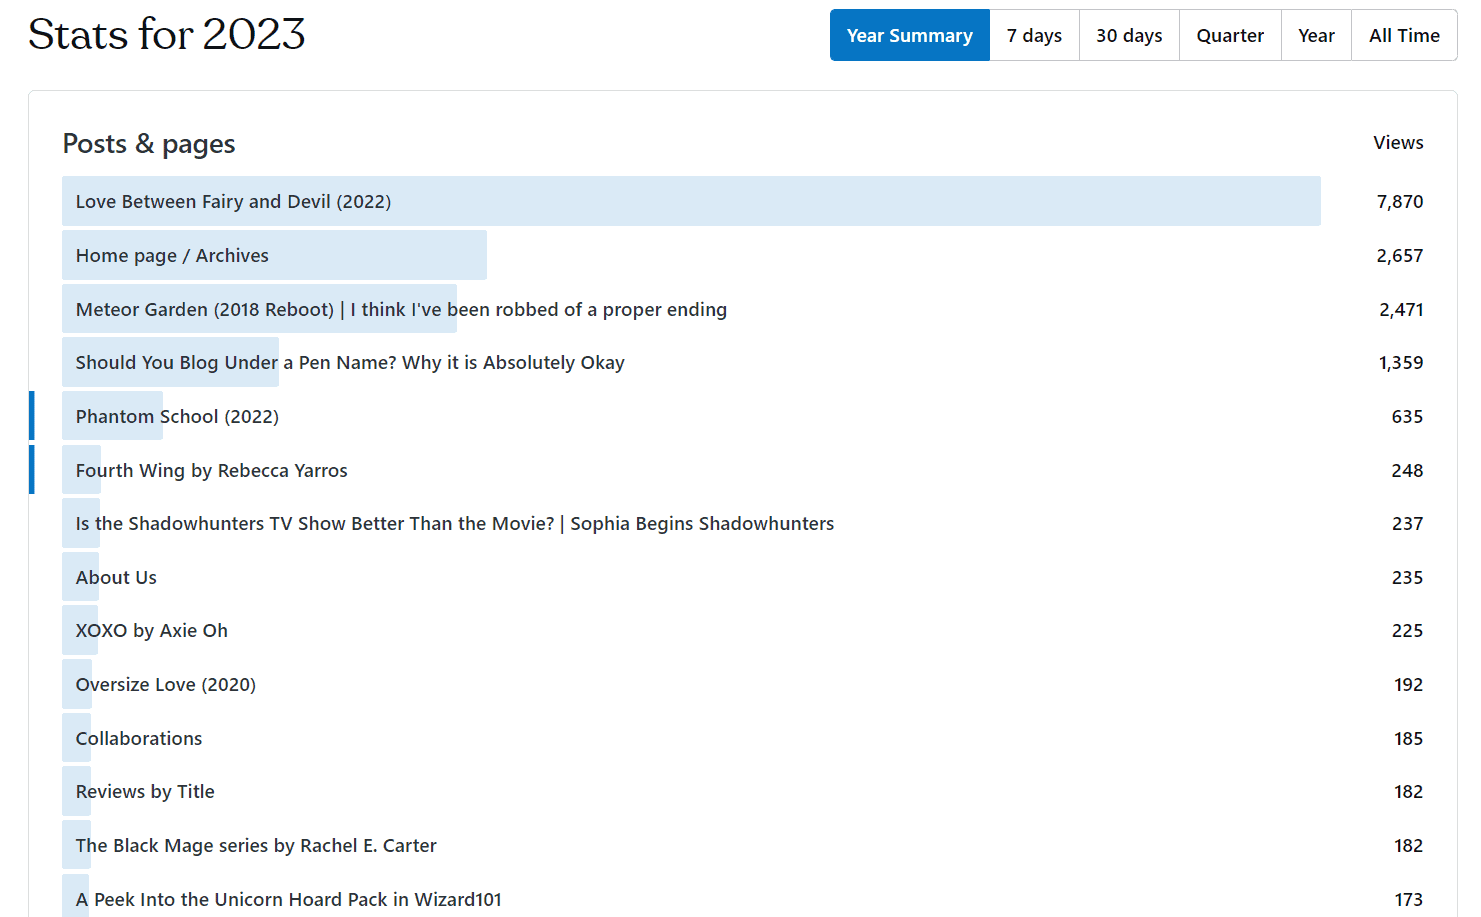
For 2023, I shared the top ten posts through the screenshot along with the views distributed across them, and then I’ve listed the top five posts that you can visit if you’re interested in reading them!
- Love Between Fairy and Devil (2022)
- Meteor Garden (2018 Reboot)
- Should You Blog Under a Pen Name? Why it is Absolutely Okay
- Phantom School (2022)
- Fourth Wing by Rebecca Yarros
Some thoughts about the posts themselves
The top 3 remains unchanged from 2022, so we won’t get into those (I also think I touched on them a little on last year’s post), but 4 and 5 have some newcomers!
Fourth Wing isn’t particularly surprising given the hype around the book, but Phantom School… that one I was surprised that it made it to the top 5 viewed posts. I personally thought the Shadowhunters post I wrote years ago would remain in the top 5 (I still can’t figure out why), or another post entirely. It’s usually 1-2 posts that pull ahead early in the year and the rest of the posts spend the year dancing around.
Despite the surprise, though, I think Phantom School ended up there because there aren’t many reviews out there about the webdrama itself from a really quick search. There isn’t much keyword competition, and from my experience, this usually happens with books (like The Black Mage series that’s also up there) that aren’t traditionally published or from a smaller publisher. People will always be finding their way to a show, movie, book, regardless of how old it is. Sometimes they want to read the reviews before picking it up, sometimes they’ll do so after. Either way, reviews will always be important to have.
This does not mean pivot all your book reviews to books from indie authors and publishers (unless you already focus on indie books). Yes, support them, but don’t do this solely for the sake of getting to the top of as many search pages as possible, if you get my drift. All the indie books I read and reviewed are ones I would’ve read even if I didn’t plan on writing a review. TL;DR: continue reading and reviewing what you want.
Another surprising post (not a Top 5, but it slid in as the 10th) is the post about the Unicorn Hoard Pack from Wizard101 which I also forgot about (and if you asked me without pulling up the post what it contained, I couldn’t tell you; I feel like it was like some sort of unhaul of a few packs — you will not see me opening a bunch of those — and some quick opinions/first impressions).
I’m not sure why it’s up there either, outside of the fact there aren’t many Wizard101 bloggers now (I could be wrong; I don’t consider myself as part of the community as I was in the past), so there aren’t many posts about the pack itself. Despite there being a wiki page and videos on YouTube, some prefer a different format when consuming content.
(Also, wikis are more for informational purposes and not opinions, so if you’re looking for opinions from a player, then you’d probably click on a blog as well because the other option is a forum or Reddit. Part of me low-key wants to experiment with this just for fun, but I also don’t want to and I don’t think I have the energy to do so.)
Comments and Engagement
As much as I wish I blog-hopped to more blogs and left comments, I ended up doing none of that (or if I did, I don’t remember it). So it is without surprise, my engagement in 2023 fell dramatically compared to 2022 and previous years. I think part of that contribution may have been the lack of posts as well: when there are no posts, there’s nothing to comment on even for the people who regularly leave comments.

I do think it’s interesting how I’ve become wordier over the years, though, but that’s unrelated.
Traffic Sources
According to Google Search Console Insights, 87% of my traffic comes directly from search engines. 11% are from direct hits, and 1% is from socials. Search Console Insights only shows the past 28 days, but I still think it’s a very interesting statistic to include.

Traffic from social media has always been my lowest, and this is largely because I’m not active (unless we count Discord, but I’m not sure how Google would categorize it on here — maybe direct since I’m directly posting the link?).
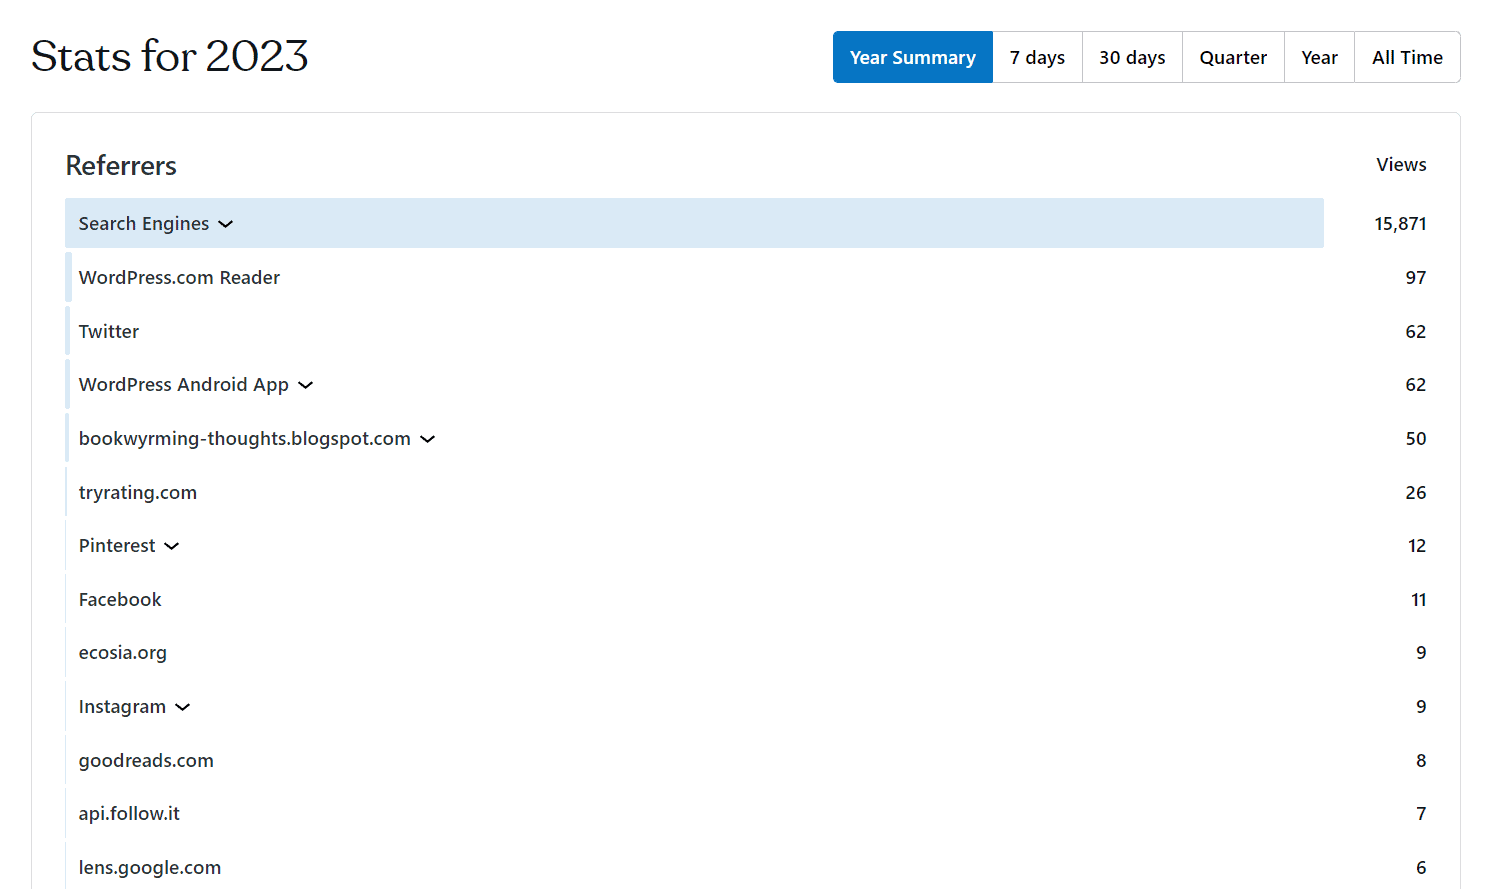
Jetpack shows similar ratios as well: most of my traffic comes from search engines, followed by the WordPress Reader, Twitter, and other social media platforms. There are a few interesting referrals like TryRating and Google Lens that haven’t been there in the past. The WordPress Android App is still listed as a separate referral, which I still find strange, but then we have Ecosia, which is listed separately even though it’s a search engine. I think Ecosia may be because it’s not a widely used search engine compared to Duck Duck Go (which does get listed under search engines), so WordPress treats it as a separate entity. This could change in later years, though.
Audience
I didn’t include this information last year, because I don’t think any of it is surprising given the world is very Western/US-Centric, but after seeing Sumedha include it in her 2022 blog statistics post, I thought it would be interesting to include it for this year. Like she mentions in her post, we don’t know if everyone’s stats have most of their readers from the United States because we don’t talk about it. (But we’re gonna change that!)
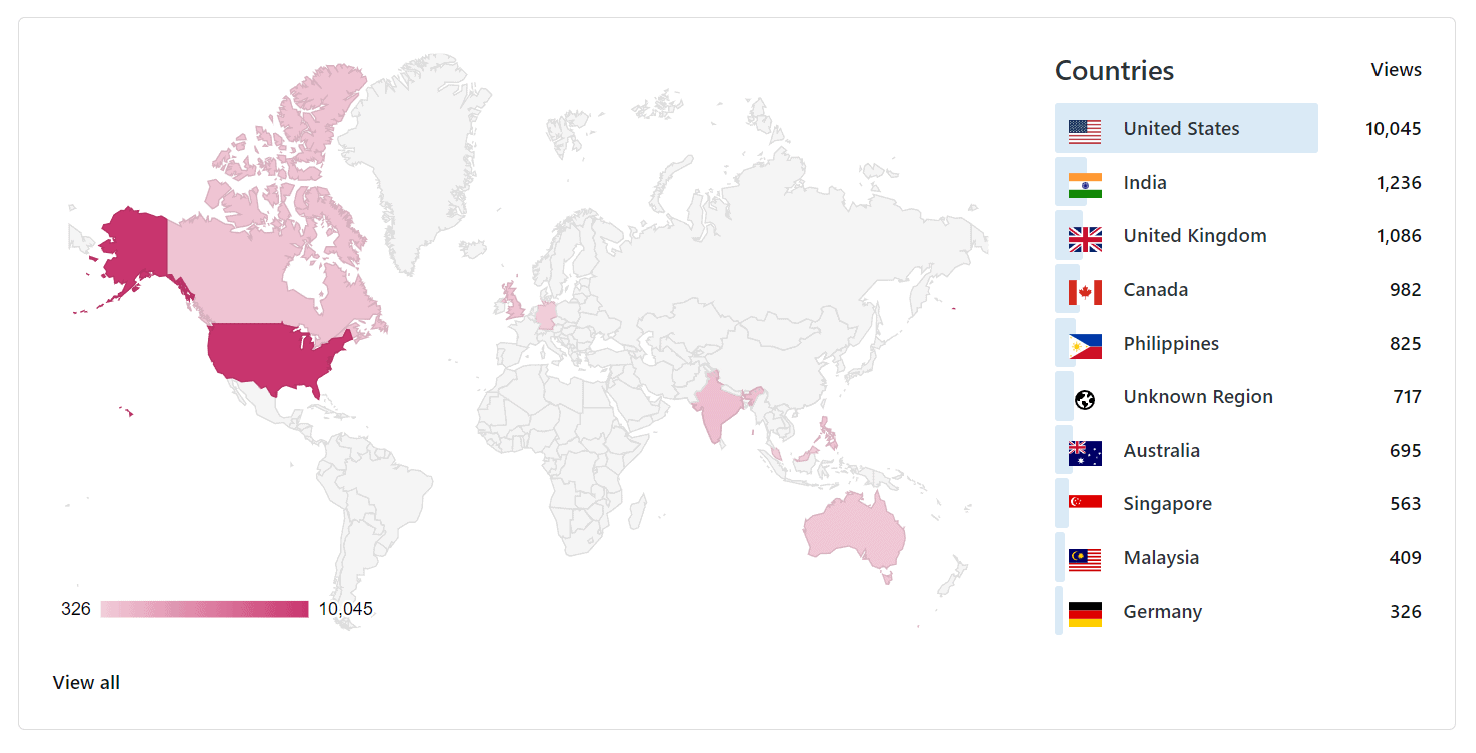
In all the years I’ve blogged on WordPress, most of my readers are from the United States. Even when the other countries changed in the Top 5, the US remains steadily as the top country. The other 4 countries usually ranged from the United Kingdom, Canada, Australia, and India in no particular order, but usually in that specific order (sometimes Canada and the UK do a little swap).

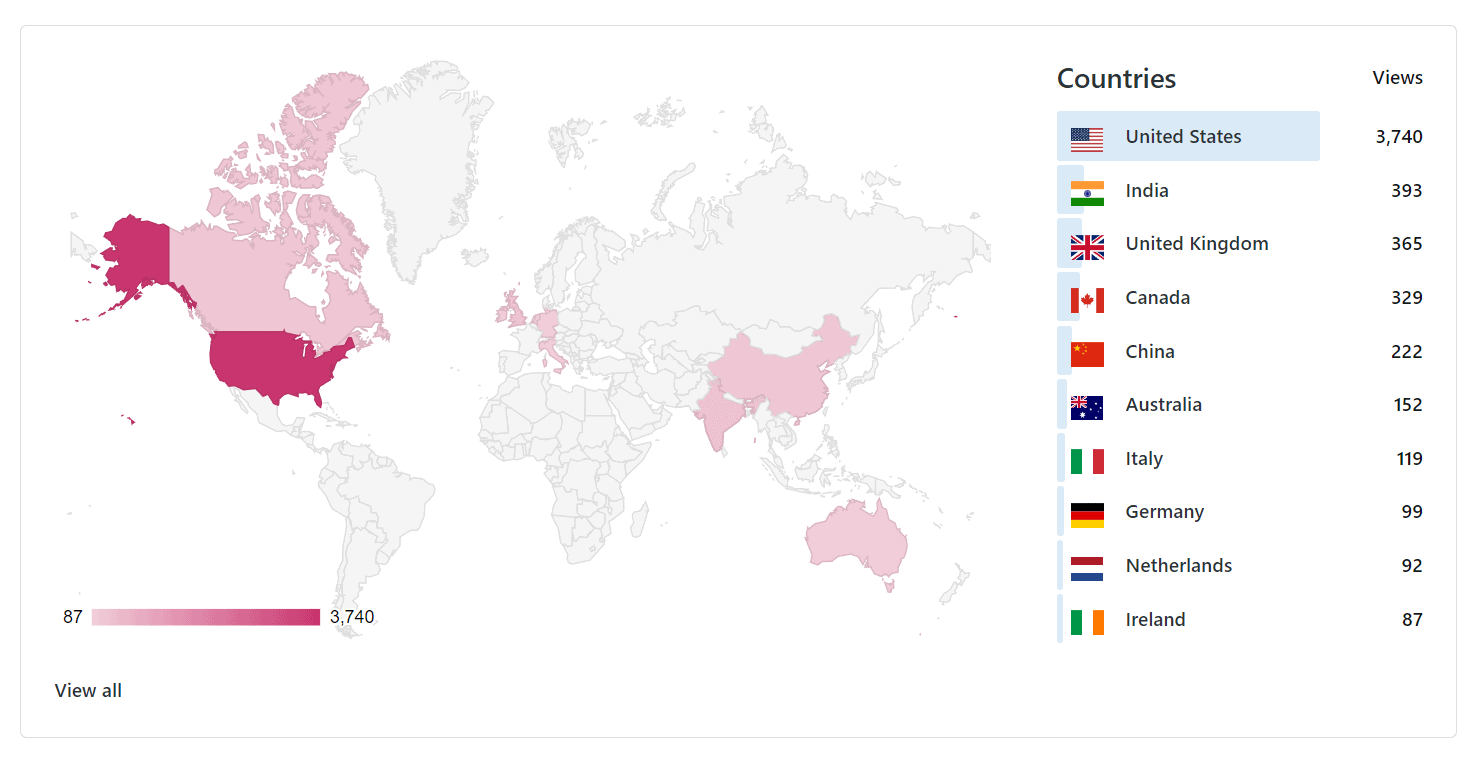
This changes in 2020, though, with China coming in 5th along with Australia, and actually coming in 5th in 2021. (I was surprised Pikachu face, too.)
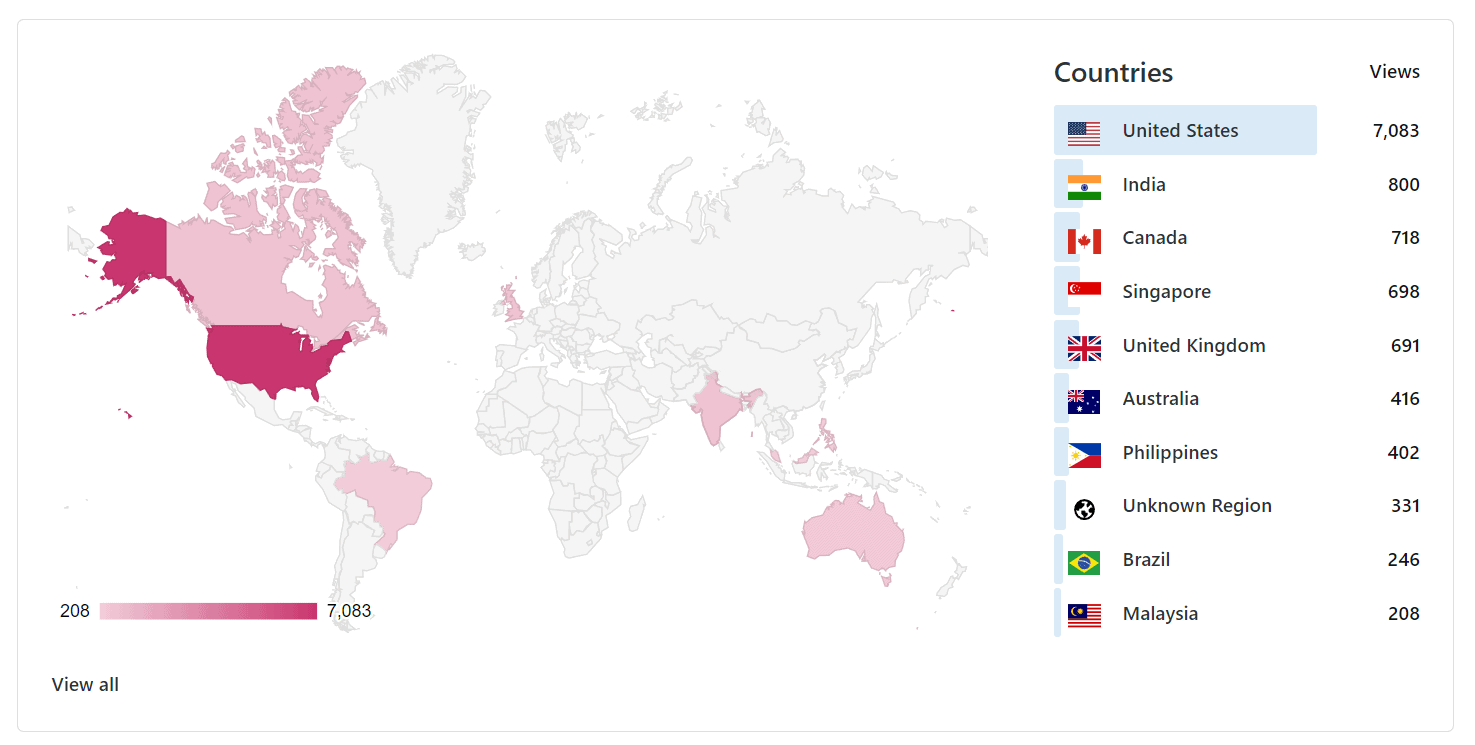
In 2022, this changes as well, with Singapore coming in 4th. China actually drops off completely, which may or may not be because of censorship. I’m not from China, so I don’t know how their policies work and I can’t speak for them. But it is very possible the amount of attention my blog was starting to get as an American (even if I may have ancestral ties to China) may have triggered something.
This does not mean my blog is completely banned (it could be, I don’t know, but I’m a mere little blogger who screams when there’s a spider on my ceiling — what am I going to do?); you can probably still access it directly if you remember the URL. I think it’s interesting, though, statistically speaking. Would it be possible the US might not even be where most of my readers come from at some point, or maybe even equally tied?
India actually comes in second for both 2021 and 2022. And in 2023, this remains about the same, with the Philippines being 5th. Part of me is happy to see my blog is reaching more readers globally while also finding it fascinating how my audience has pivoted over the years. I think it’ll be interesting to see how this changes in the coming years as well, and if you’ve made it this far (this is a long post, lol, but I guess it’s not as long as last year’s?), then you might be interested as well.
Now that I think about it, I really should have included this last year. Mistakes were made in my decision making, but we’re fixing that this year!
Final Thoughts
We’re a little more organized and less wordy this year — yay! If you made it this far, kudos to you — I know statistics can be uncomfortable, especially when it seems to be taboo to even talk about them.
But I hope this provided some insights, and perhaps over time we’ll see more bloggers comfortable talking about their statistics as well. If you’re thinking about doing a post on your blog statistics, let this be my encouragement to you! I’d love to see your insights as well (even if I’m a terrible blog hopper). And remember: every blogger’s success is different, so please don’t let my numbers make you feel bad about yours (easier said than done, tbh), because you are doing great.
Finally, thank you to everyone who’s visited throughout the year, left comments, liked posts; I appreciate all of you. 🥺
Update March 1, 2024
WordPress and Tumblr are selling your data to AI companies to train their models. In other words, if you have a blog hosted on WordPress.com and Tumblr, your content is getting profited and they’re making money off your hard work.
Given that I’m on self-hosted WordPress, this doesn’t apply to me, but I do use the Jetpack plugin, which is owned by Automattic (the company behind WordPress.com and Tumblr), and the plugin I use when creating these posts. This may end up affecting next year’s post as I may opt to remove Jetpack completely in favor of using a different analytics plugin, but this has yet to be determined.
In the meantime, if you’re a blogger hosted on WordPress.com (even if it’s a plan paid on their site — if you’re with a web host like BlueHost, then you’re self-hosted, which is WordPress.org) and aren’t comfortable with this at all (I’m frankly disturbed), you should check your privacy settings to opt out of this.

Sophia started blogging in February 2012 for the hell of it and is surprisingly still around. She has a GIF for nearly everything, probably listens to too much K-Pop and is generally in an existential crisis of sorts (she's trying her best). More of her bookish reviews and K-Pop Roundups can be found at The Arts STL.
If you enjoy her posts or found them helpful, consider tipping on KoFi!

loved all the insights here! search engine traffic really contributes to a lot because no matter the post schedule, the stats are around the same. and thanks for sharing your audience stats, interesting to see Philippines and Aus because it’s the same for me too!
i was totally planning to make a 2023 stats post, esp cuz my 2023 stats are a little depressing compared to 2022’s and i wanted to normalize it and talk about why but uh… i forgot lol. totally. and it’s march already. your encouragement helps but idk if i’ll write it now, it’s quite a bit of work 😂
It is! But it’s absolutely worth it, and yes, you should definitely do it!
I love seeing blog stats! What’s so interesting for me is how various old posts can just get such a surge in views. One of my book reviews from 2019 is basically my top viewed post I think? Like it got more views last year than it ever did the first year it was published.
I LOVE THAT FOR YOU! That’s happened to me a few times as well, and it’s always nice to see it pop up. Sometimes it’s not a surprise at all, other times it’s a complete surprise.
Thanks so much for sharing this! It is really interesting to see people’s stats, and I’m actually terrible at finding and reading my stats so it is really helpful to see the kinds of things that you are looking at!
I’m glad you found this helpful!